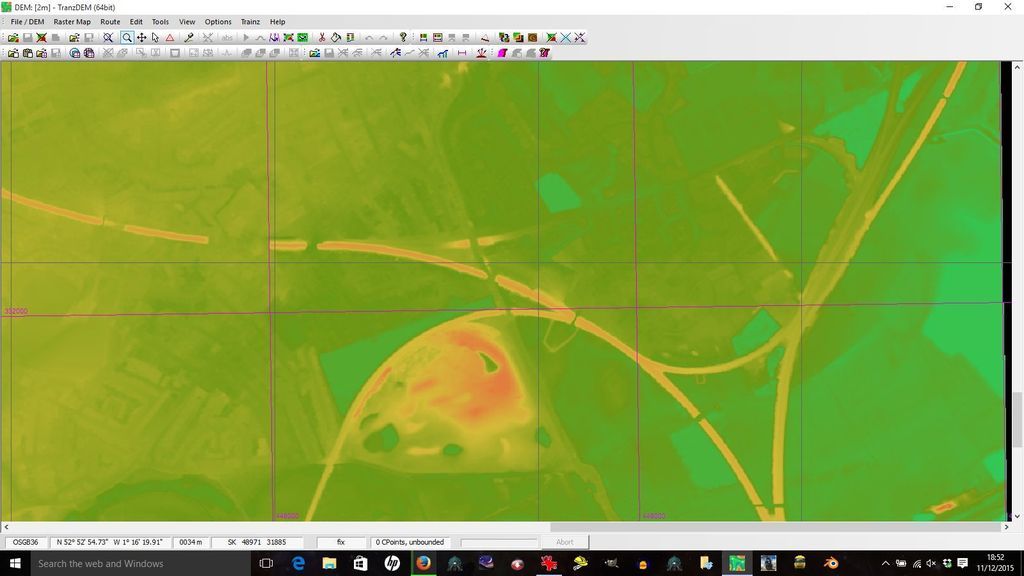
In this Transdem screenshot, the railway embankments are very clear, the colour range showing the height. The main line, from Trent Sth Jn (the bottom edge on the right), can be seen to fall slightly to Trent Jn (up to the right), with the High Level Goods line climbing to cross the main line.
The West Curve also climbs slightly to Sheet Stores Jn, (right of centre of the image), where the main lines split to the Derby (left edge) and Chellaston (bottom edge on left side) lines. The northern side of the triangle, actually the East Curve, also climbs from right to left. "Mouse-over" the image in Transdem shows Trent Jn at 31m, and Sheet Stores Jn at 34m. In the screenshot the mouse was placed over Sheet Stores Jn, 34m shows in the bottom of the window.
In Trainz, the area looks like this, looking SE towards Sheet Stores Jn, with the Derby & Chellaston lines converging, then the East & West Curves diverging again. Also the road over the canal (on the former course of the railway) can be seen rising to the bridge gap then falling again.
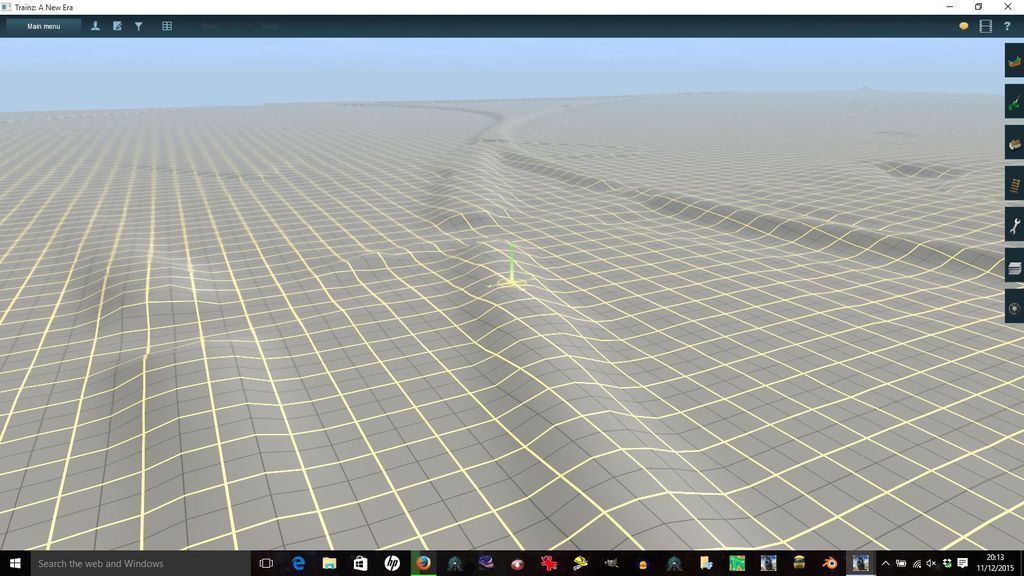
Using the Get Height function in Surveyor tabs, the height of the compass comes out at 33.64m.
It seems to me as if there may be almost too much detail in the 2m Lidar data, it may be easier to build on the older Landform Panorama data, but use the 2m Lidar data in Transdem to get the exact height of the trackbed at certain points, by "mouse-over"ing in Transdem at those points.
More experimenting needed here.


