TransDEM Forum

TransDEM News, Support, Hints and Resources
It is currently 10 Nov 2024 20:24

All times are UTC + 1 hour


Post new topic Reply to topic  [ 20 posts ]  Go to page 1, 2  Next
Author Message
 Post subject: USGS GeoPDF
PostPosted: 01 Apr 2013 12:33 
Offline

Joined: 05 Jan 2011 16:45
Posts: 1489
USGS downloadable topo maps are in GeoPDF format. GeoPDF, like PDF, is regarded as a "final" format and, unlike GeoTIFF, not intended for further processing. It is still possible to extract the data from a GeoPDF file, but it is more complex than with other file formats.

To extract the map image alone, several image editing programs, including Photoshop or Gimp, will provide the necessary functionality. The easiest way, in my opinion, is IrfanView, with the plugins and also Ghostscript installed. But all these methods will lose georeferencing information - which is included in the GeoPDF file, a similar concept to GeoTIFF vs plain TIFF. However, GeoPDF is a proprietary format and GeoTIFF is open.

So, with the image extracted, we could now use standard 3 point georeferencing in TransDEM and achieve satisfying results. But wouldn't it be nice to have a more automated method by accessing the embedded georeferencing information in one way or another?

One possibility - and presumably the only reasonable one - is GDAL, an open source software library. GDAL handles dozens of geo data formats and has already been of use to TransDEM, for ESRI Binary Grid (*.adf) and the upcoming ERDAS Imagine (.img).

GDAL can work with GeoPDF but relies on another external library for this. This part is still in development. Furthermore, GDAL itself has a free license (X11/MIT), but that external library is licensed under GPL which is unsuitable for TransDEM.

Things may change in the future but for the time being I will not pursue direct GeoPDF support in TransDEM. But partial automation is a realistic option.

The additional step would be to extract both the image and the georeferencing from the GeoPDF file. This would remain a manual step.

A binary distribution of GDAL comes with a console program called gdal_translate.exe. gdal_translate.exe can take the GeoPDF as input and produce a JPEG image as output. It can also produce an ESRI world file with basic georeferencing information. Unfortunately, this does not suffice.

I have checked two different USGS GeoPDF map samples, a modern one and a historical one.

The modern one is in UTM/NAD83 projection, but slightly rotated. TransDEM can process world files, but only without rotation. I am still struggling here.

The older one is in Polyconic projection. Now what the heck is "Polyconic"? It has been used by USGS for decades but you will never see any polyconic coordinates. "Snyder" has the formulas, numeric examples, and also background information. It turns out that for large scale topo maps, Polyconic was used to create the layout of a particular map on paper and for nothing else. So each map may have its own projection, a so-called local projection, similar to every town having its independent clock tower before the arrival of standard time. Therefore, polyconic coordinates are not interchangeable and therefore make not much sense at all. Hence, you don't see them printed. And we didn't care in the past, as those older USGS quadrangles delivered perfect results when georeferenced as UTM/NAD27.

Now, the GeoPDF file for a "polyconic" map takes polyconic literally and actually comes up with those unfamiliar projection coordinates in the georeferencing appendix. Because this projection is regarded as a local one, we also need some reference, what "local" actually means for a particular map, in form of a central meridian. That's the way the US polyconic projection defines itself. Usually, the central meridian of the projection is the central meridian of the map quadrangle, making it local indeed.

The world file, unfortunately, does not tell us the central meridian longitude. GDAL produces an additional file, though. It's in GDAL xml format and we find central meridian there. TransDEM needs to parse both the world and the auxiliary xml file. Since yesterday, it works in my software lab.

Thus, the next version of TransDEM will offer automatic georeferencing for polyconic maps, offered as a plain raster image and accompanied by both the world file and the GDAL auxiliary xml file.

The procedure with TransDEM will consist of these steps:
  1. Download (historical/polyconic) GeoPDF map from USGS server. in this example it is a 15' quadrangle from 1943.
  2. Extract with gdal_translate.exe.
    Code:
    F:\Data\DigitalMapping\TransDEM\geopdf>gdal_translate -of jpeg -co "worldfile=yes" MO_Ozark_325125_1943_62500_geo.pdf MO_Ozark_325125_1943_62500_geo.jpg
    It produces the jpeg file, the world file, and the auxiliary xml file.
    Image
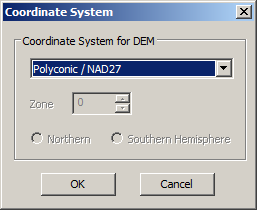
  3. Open the image file in TransDEM and select Polyconic/NAD27 projection.
    Image
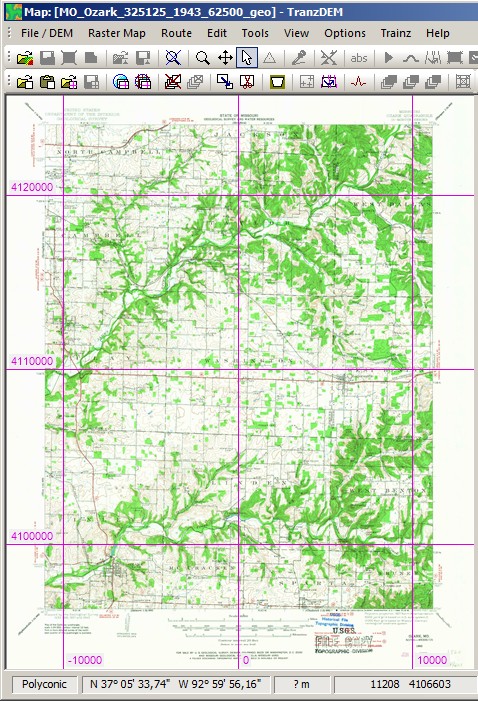
  4. TransDEM will look for the world file and because polyconic has been selected, the auxiliary xml file. If all is fine TransDEM will show the polyconic grid, typically with an easting of 0 for the central meridian in the map.
    Image

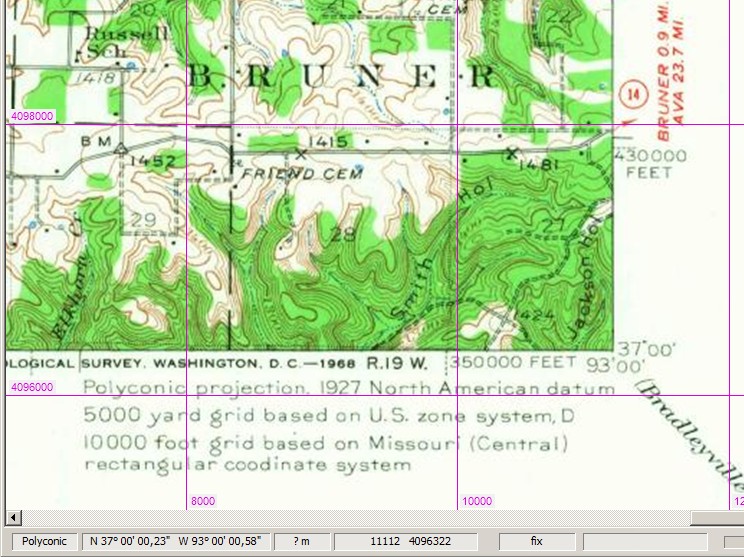
    The projection coordinates are of no use outside the georeferencing procedure. Latitude and longitude, however, do matter and they should fit, compare SE corner of the map with the TransDEM status line:
    Image
  5. Convert to UTM.
  6. Optional: Crop the "map collar", using the "Transparent Margins" tool.
  7. Save.


Top
 Profile  
 
 Post subject: Re: USGS GeoPDF
PostPosted: 01 Apr 2013 12:42 
Offline

Joined: 20 Nov 2012 01:41
Posts: 65
geophil,

Would TerroGo's GeoPDF toolbar be of any assistance to TransDEM? I downloaded this utility months ago and worked with it for a while but have forgotten what it can do. If I remember correctly, it was NOT a free download. If I can find my notes on it, I'll post back later with more information if you need it.

Andrew


Top
 Profile  
 
 Post subject: Re: USGS GeoPDF
PostPosted: 01 Apr 2013 15:53 
Offline

Joined: 05 Jan 2011 16:45
Posts: 1489
I don't think it supports unobstructed access to the underlying data. In my opinion this whole GeoPDF concept is moving into the wrong direction. It may help some end users (and it's an end user format, of course) but that comes at the price of encapsulation. I am only speculating here, but with the budget constraints it could be one of those public/private partnership projects, where the public data the USGS has to provide is distributed in a format not completely blocking access, but encouraging users to purchase additional products from TerraGo for using the maps. The TerraGo ad on the USGS download site speaks for itself. And the Wikipedia entries for GeoPDF and geospatial PDF seem to be taken from the product promotion leaflet directly.


Top
 Profile  
 
 Post subject: Re: USGS GeoPDF
PostPosted: 09 Apr 2013 18:06 
Offline

Joined: 05 Jan 2011 16:45
Posts: 1489
Continuing the TransDEM GeoPDF story:

The opening page for the USGS historical map collection (http://nationalmap.gov/historical/) has 12 maps of Oklahoma City between 1893 and 2012 as an example series. I tried to run them all through the TransDEM georeferencing process and find missing pieces. It turned out that I needed to add two more projection variants. While all the older ones are Polyconic and the latest ones UTM/NAD83, there was a transition period with more variety. The 1986 example is Lambert Conic Conformal and the 1995 sheet is non-UTM Transverse Mercator. Both these projections existed in TransDEM but I had to add custom variants which accept dynamic parameters.

To feed these parameters I had to extract more values from the GDAL auxiliary xml file. And while I was doing this I also added an auto-select function for the coordinate system. If sufficient information is provided in the aux xml file, no dialog will pop up for the user to choose the coordinate system. TransDEM will handle it. The standard world file, which TransDEM can process since version 2.2, only contains transformation values but no meta data.

The test results for the 12 maps are now as follows:
  1. Oklahoma City, 2012, 7.5' quadrangle, 1:24,000, rastered vector map, (orthoimage layer off):
    UTM/NAD83, recognized and processed by TransDEM as UTM/WGS84 (identical to NAD83 for our purposes), world file with rotation. Correct result.
  2. Oklahoma City, 2012, 7.5' quadrangle, 1:24,000, rastered vector map (orthoimage layer on):
    Same as above. Gdal_translate 1.10 will be used to switch layers off at the user's end.
  3. Oklahoma City, 2009, 7.5' quadrangle, 1:24,000, rastered vector map (orthoimage layer off):
    My gdal_translate standard installation cannot extract georeferencing information from the GeoPDF file. Error detected correctly by TransDEM, manual selection of coordinate system required. World file with rotation. Correct result.
  4. Oklahoma City, 2009, 7.5' quadrangle, 1:24,000, rastered vector map (orthoimage layer on):
    Same as above. Gdal_translate 1.10 will be used to switch layers off at the user's end.
  5. Oklahoma City, 1995, 7.5' quadrangle, 1:24,000, raster map:
    Local Transverse Mercator/NAD83, recognized and processed by TransDEM as custom Transverse Mercator. Correct result.
  6. Oklahoma City, 1986, 7.5' quadrangle, 1:24,000, raster map:
    Local Lambert Conic Conformal, 2 standard parallels/NAD27, recognized and processed by TransDEM as custom Lambert. Correct result.
  7. Oklahoma City, 1975/1956, 7.5' quadrangle, 1:24,000, raster map:
    Local Polyconic/NAD27, recognized and processed by TransDEM. Correct result.
  8. Oklahoma City, 1969/1956, 7.5' quadrangle, 1:24,000, raster map:
    Local Polyconic/NAD27, recognized and processed by TransDEM. Correct result.
  9. Oklahoma City, 1956, 7.5' quadrangle, 1:24,000, raster map:
    Local Polyconic/NAD27, recognized and processed by TransDEM. Correct result.
  10. Oklahoma City, 1956, 15' quadrangle, 1:62,500, raster map:
    Local Polyconic/NAD27, recognized and processed by TransDEM. Correct result.
  11. Oklahoma City, 1893, 15' quadrangle, 1:62,500, raster map:
    Local Polyconic/NAD27, recognized and processed by TransDEM. Correct result.
  12. Chickasha, 1904, 30' quadrangle, 1:125,000, raster map:
    Local Polyconic/NAD27, recognized and processed by TransDEM. Correct result.

Here are some images:

Recent 7' 30“ 1:24,000 map, 1956 15' 1:62,500 map, 1904 30' 1:125,000 map on top of each other:
Image

Details of the transition between the recent and the 1956 map. While freeways don't have a counterpart, some of the smaller roads and the railway do.
Image

It is more difficult for the 1904 and the 1956 map. Not that many man-made features. But the Canadian River has more or less the same bed.
Image

The next step will be to automate extraction of the data from the GeoPDF file, launching and controlling gdal_translate.exe from TranDEM.


Top
 Profile  
 
 Post subject: Re: USGS GeoPDF
PostPosted: 17 Apr 2013 21:26 
Offline

Joined: 05 Jan 2011 16:45
Posts: 1489
The GDAL link for importing GeoPDF is making progress.

gdalinfo.exe is used to retrieve image size and potential layers (modern maps only).

Layers and size are shown in this dialog:

Image

The user can select/deselect layers and adjust size.

With the new parameters from this dialog, TransDEM will create the command line for gdal_translate.exe and run this utility as a sub-process (just as it did with gdalinfo.exe before):
Code:
"C:\Program Files (x86)\GDAL\gdal_translate.exe" -of PNG -co worldfile=yes
"F:\Data\DigitalMapping\TransDEM\geopdf\OK_Oklahoma_City_20121211_TM_geo.pdf"
"F:\Users\Roland\AppData\Local\TransDEM\temp\OK_Oklahoma_City_20121211_TM_geo.png"
--config GDAL_PDF_DPI 131.867 --config GDAL_PDF_LAYERS_OFF "Map_Collar,Images"


This will produce the image file, the world file, and the GDAL .aux.xml file. TransDEM will then process the image file and its accompanying helpers.

This entire chain now works but will need a bit of fine tuning, like visualizing the gdal_translate progress report.


Top
 Profile  
 
 Post subject: Re: USGS GeoPDF
PostPosted: 02 May 2013 19:22 
Offline

Joined: 05 Jan 2011 16:45
Posts: 1489
Another lab report:

The USGS GeoPDF files come with a nice meta data feature, the so-called "neatline", which tells us the border of the actual map frame. On a raster image, which is all pixels, we can't guess it and would need sophisticated image processing to find it.

One of the TransDEM features is the "Transparent Margins" function. It first makes the map collar transparent and will then reduce the map image to the smallest rectangle encompassing all non-transparent pixels.

Normally, the user has to adjust the mask manually to fit the map frame. In the case of USGS GeoPDF topo maps, this can be automated.

In this automation, TransDEM will extract the neatline from the GeoPDF meta data, eliminate any collinear points to make it a quadrangle and initialize the transparent margin mask with its values (shown in dark yellow):

Image

At a closer look we find that the mask fits the map frame precisely (semi-transparent dark yellow overlay):

Image

The final result, converted to UTM/WGS84, no longer has any white space around the net content. Transparent areas appear in black here.

Image


Unfortunately this does not work quite as well with the modern maps. It looks okay at first glance:

Image

But there is some white space between the neatline and the map frame and we don't know why.

Image

I'm afraid we have to live with it.


Top
 Profile  
 
 Post subject: Re: USGS GeoPDF
PostPosted: 02 May 2013 20:50 
Offline

Joined: 20 Nov 2012 01:41
Posts: 65
Looks great, geophil! I have a folder full of historical GeoPDF's saved up that I can't wait to unleash TransDEMs new automated features on!


Top
 Profile  
 
 Post subject: Re: USGS GeoPDF
PostPosted: 03 May 2013 20:32 
Offline

Joined: 05 Jan 2011 16:45
Posts: 1489
Four historical USGS 15' quadrangles in Pennsylvania: Huntingdon, Mount Union, Broad Top and Orbisonia, from the 1930s and 40s. GeoPDF in Polyconic projection, georeferenced in TransDEM, embedded neatline applied to cut off map collar, converted to UTM zone 17 and joined together as a group. (The 78th meridian is the border between zones 17 and 18):

Image


Top
 Profile  
 
 Post subject: Re: USGS GeoPDF
PostPosted: 03 Jul 2013 12:33 
Offline

Joined: 05 Jan 2011 16:45
Posts: 1489
Upcoming TransDEM 2.4 is currently undergoing some final testing.

Two more images from this testing phase, GeoPDF again, since this is the major new feature.

The USGS historical collection home page shows a series of 7.5 min 1:24,000 maps of Chattanooga, TN. From this series we compare the 1936 and the 2013 edition. For the modern map, with its vector data, the railroad layer has finally arrived. Unfortunately, showing the main tracks only, it leaves a lot to desire. Therefore, the historical maps may still be more valuable to us.

ImageImage


Top
 Profile  
 
 Post subject: Re: USGS GeoPDF
PostPosted: 03 Jul 2013 16:34 
Offline

Joined: 30 Jan 2011 13:03
Posts: 170
G'day geophil,

Roland, in defence of these current maps, could the apparent 'lack' of railway activity shown merely be a 'correct' reflection of the 'current state of affairs' at that location? I observe a number of changes in the map that clearly indicate a situation, in some places, that could not exist, now, if the extensive rail yards still existed where they were in 1936...

Jerker {:)}


Top
 Profile  
 
Display posts from previous:  Sort by  
Post new topic Reply to topic  [ 20 posts ]  Go to page 1, 2  Next

All times are UTC + 1 hour


Who is online

Users browsing this forum: No registered users and 3 guests


You cannot post new topics in this forum
You cannot reply to topics in this forum
You cannot edit your posts in this forum
You cannot delete your posts in this forum

Search for:
Jump to:  

Imprint & Privacy

Powered by phpBB® Forum Software © phpBB Group