The LRIS portal (see
here) has made available their 25 m DEMs. The product is called NZDEM.
They were created by
Landcare Research from the 20m contour lines of the LINZ 1:50,000 maps. (Read more about the making of these DEMs here:
Development of a High Resolution Digital Elevation Model for New Zealand).
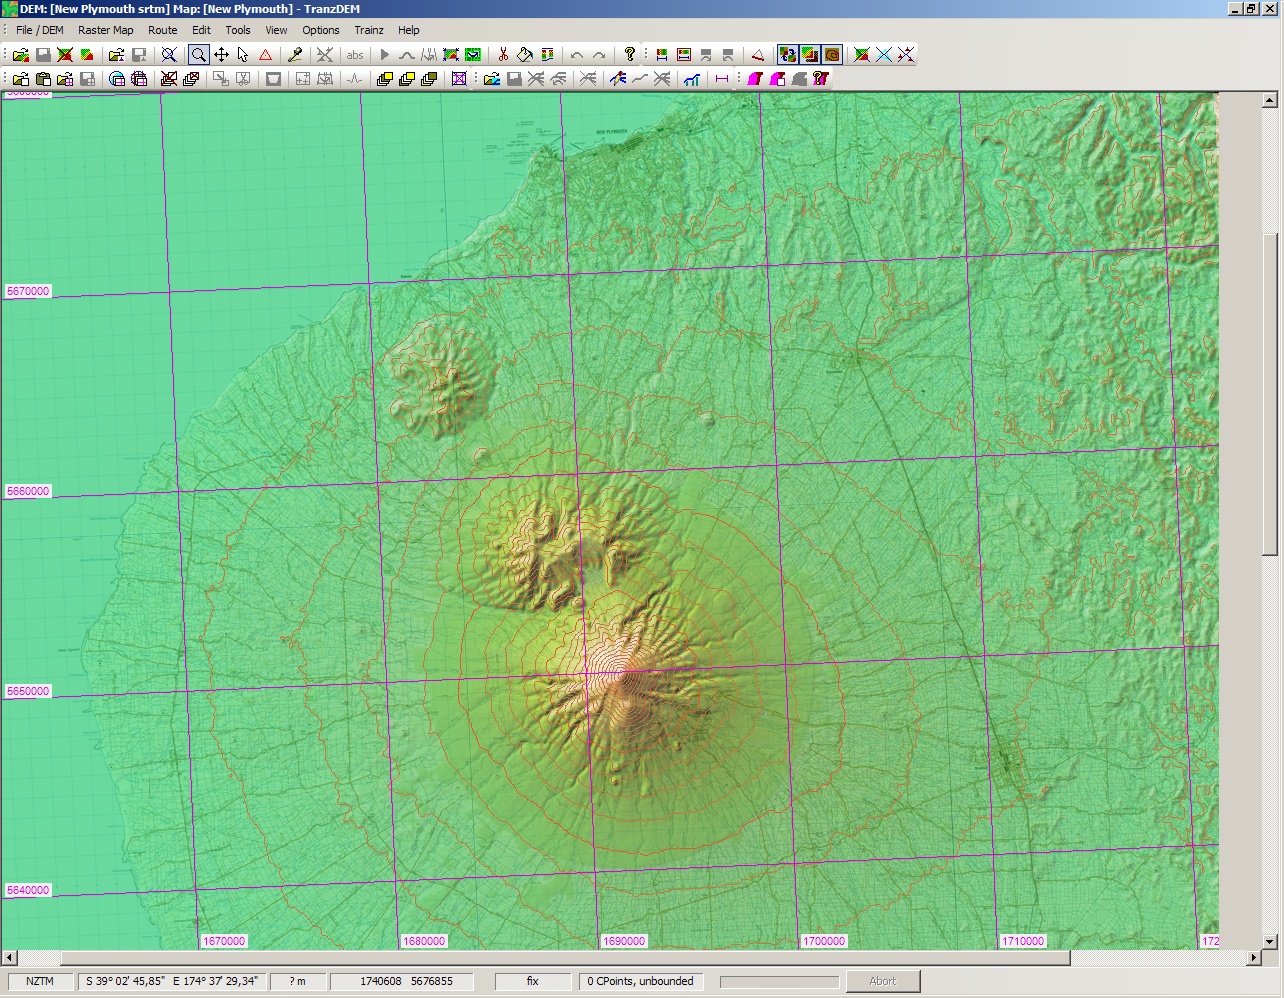
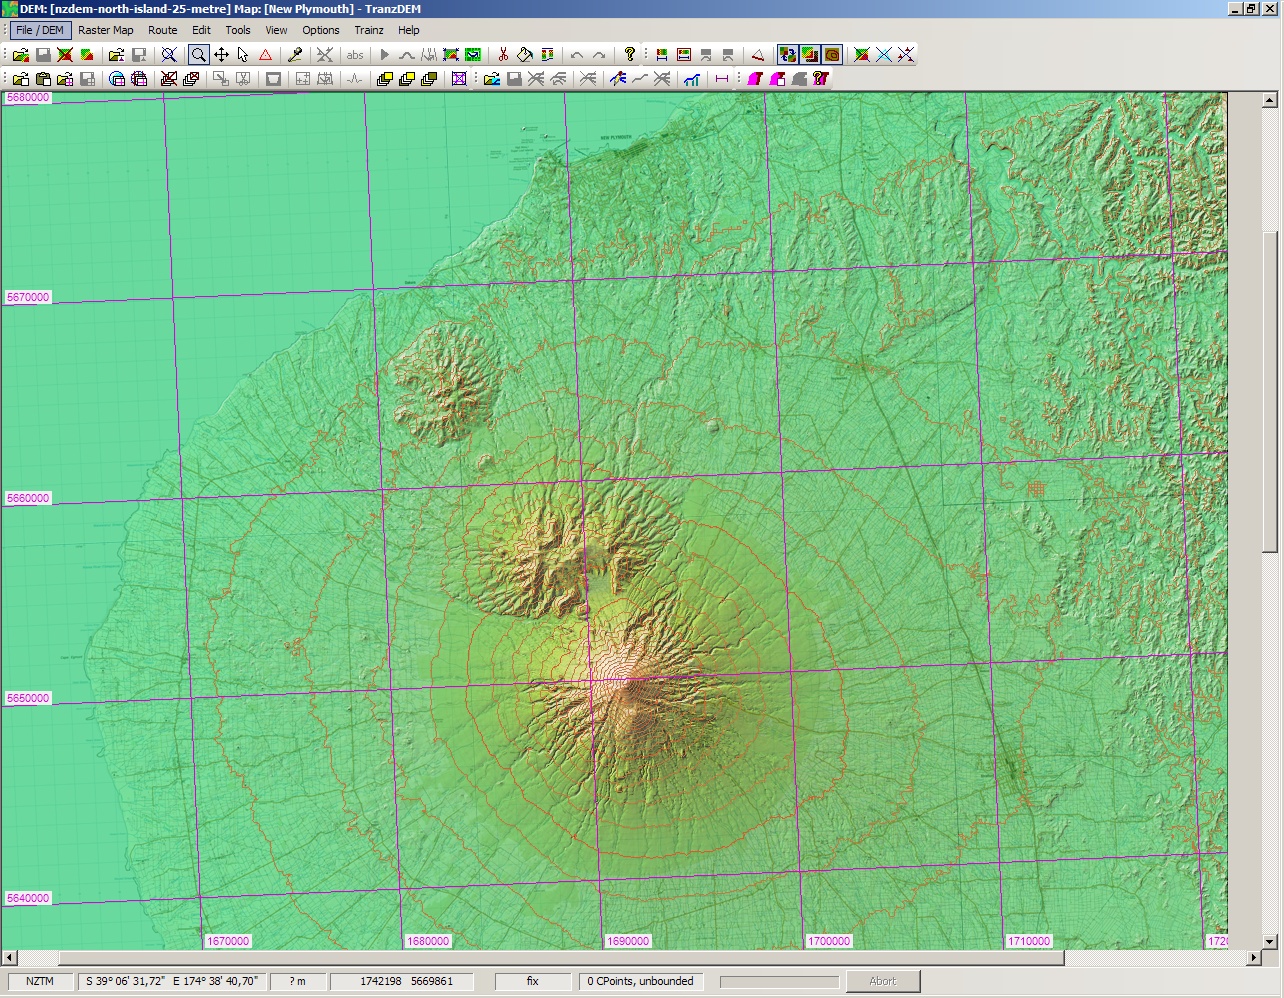
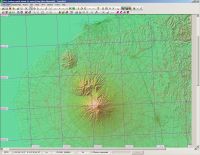
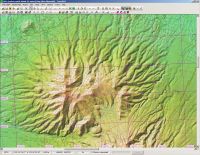
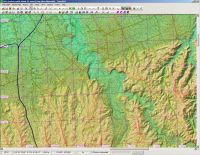
I had a closer look at these DEMs and for this I picked the Taranaki Region on the North Island, famous for its (quiescent) volcano. I will compare 25m NZDEM (right) to standard SRTM 3 arc sec (left). Click on the images for full size.
First the entire northern half of the peninsula. LINZ Topo50 maps on top of the DEM. Not much difference at this scale.

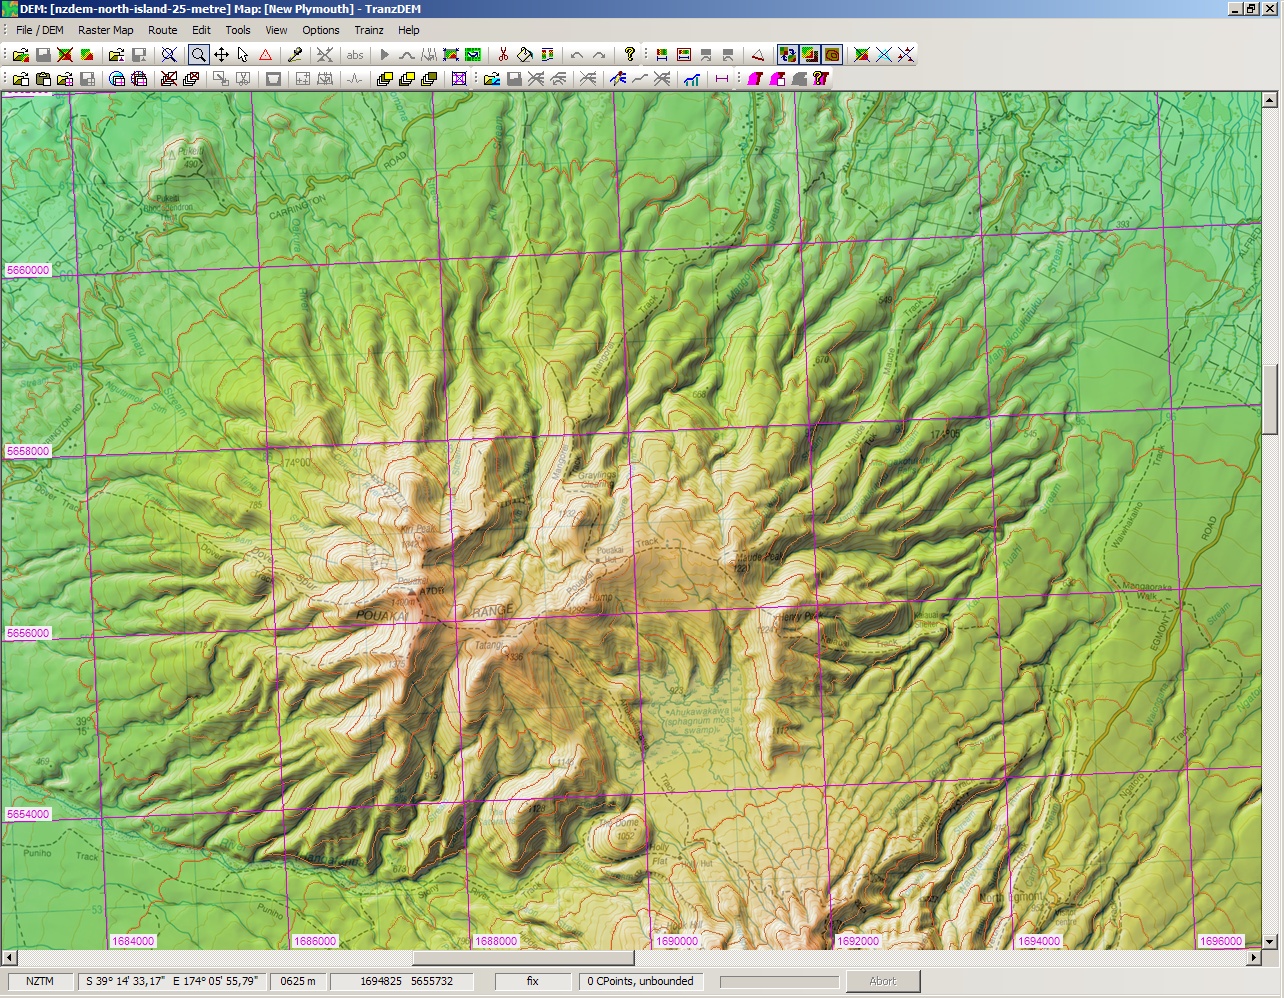
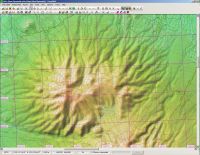
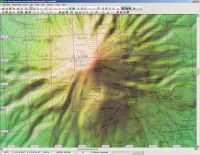
Now we are zooming in. The lower Pouakai Range to the north of the main peak. See how closely the DEM-derived contour lines fit to those the topo map for NZDEM.
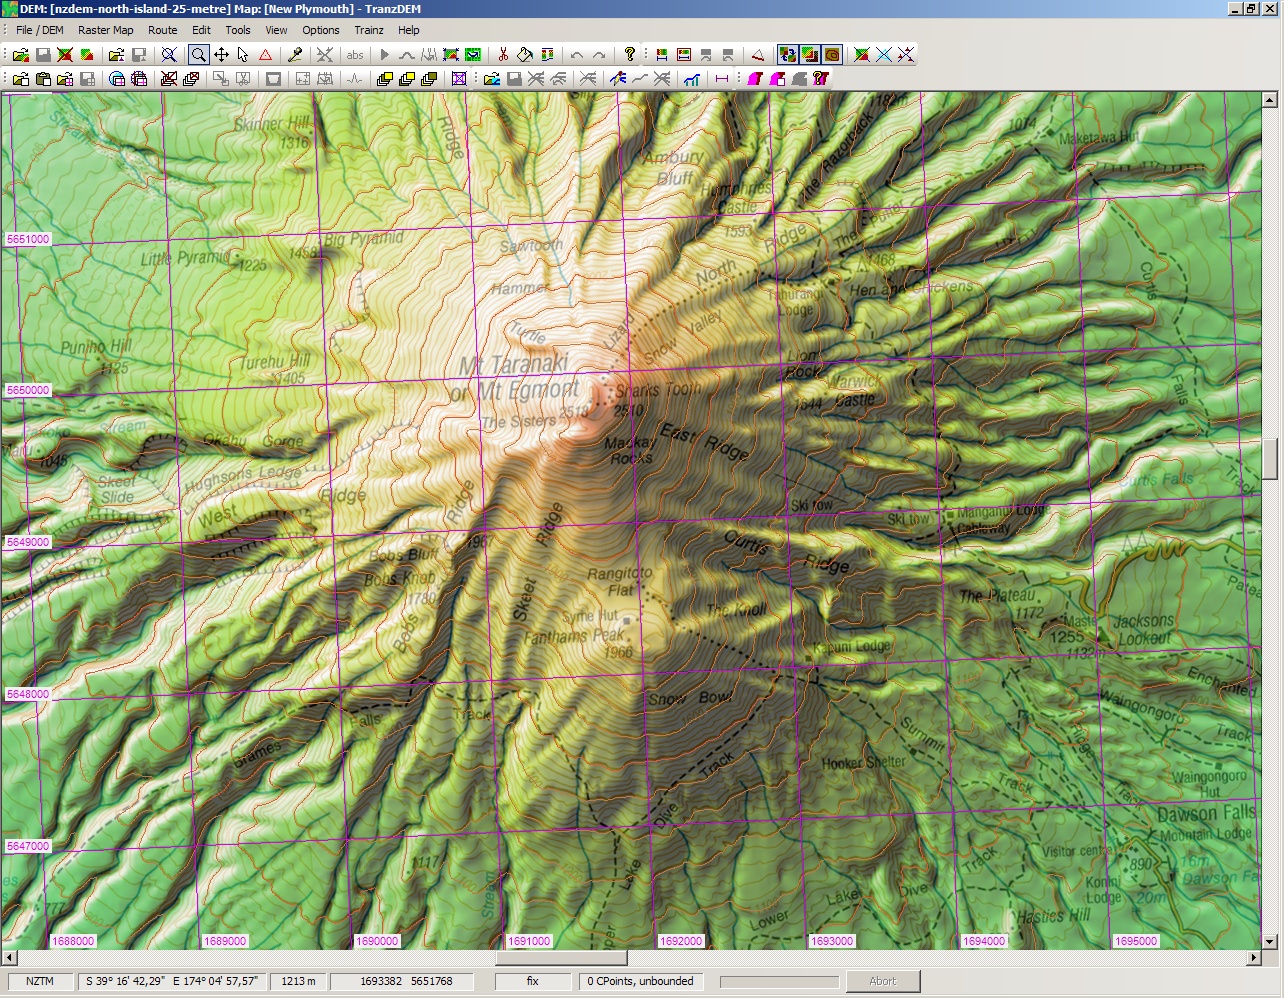
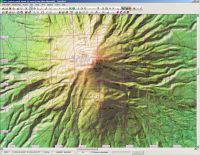
Next is Mt. Taranaki or Mt. Egmont itself with its spectacular conical shape. Again, compare the 100m DEM contour lines, both DEM-derived and on the map.
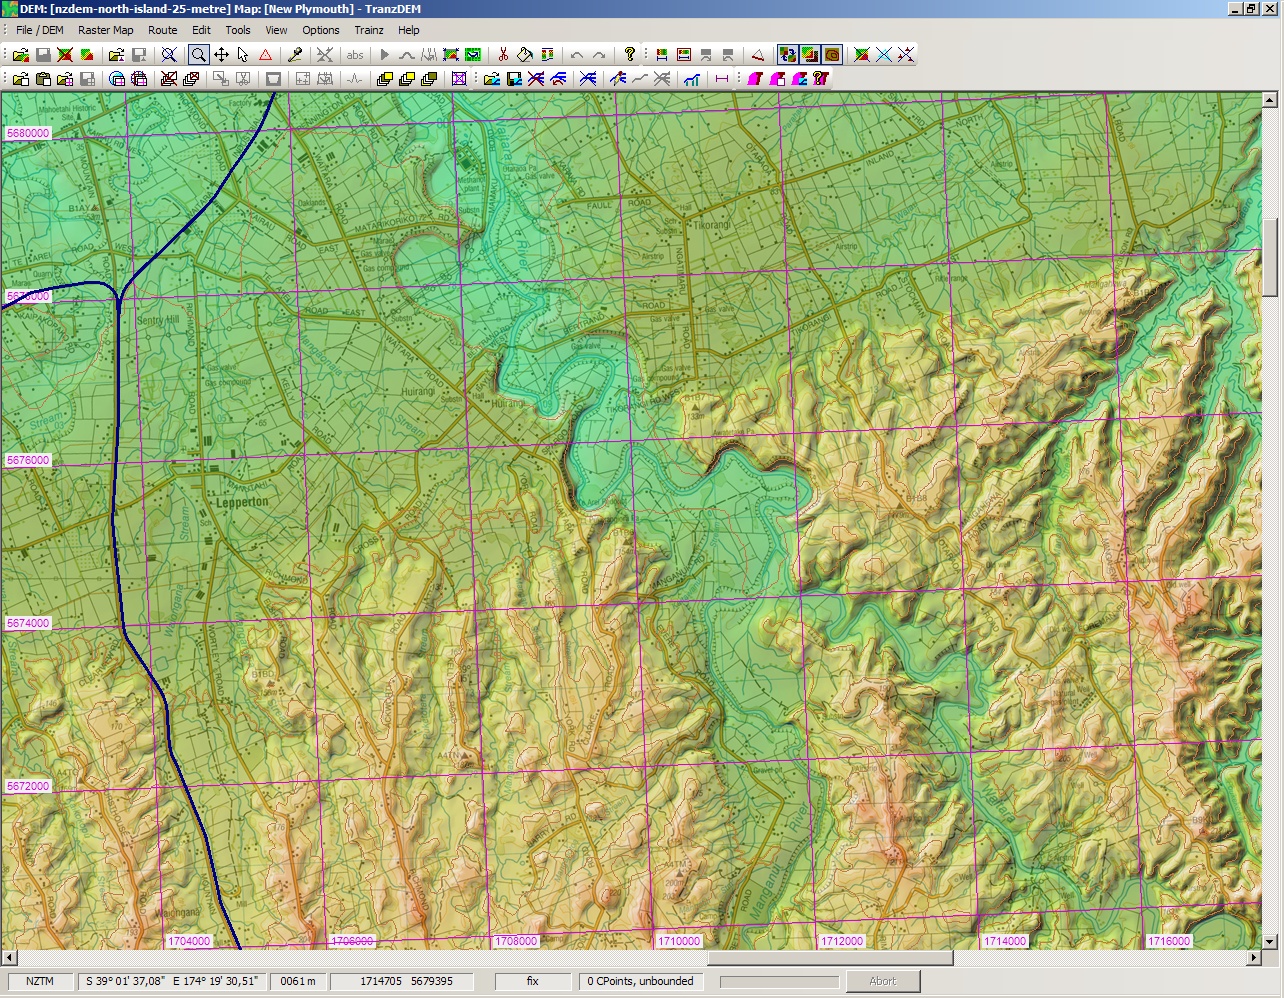
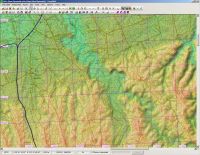
The last DEM image is taken to the north-east of the volcano, the Waitara river bed, this time with the railway vector layer added, the New Plymouth Line and the branch to Waitara.
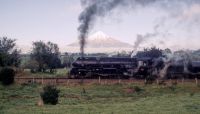
Finally, the real thing, from a more earthly perspective. Photo taken a good decade ago, during the "Bluff 2000" tour.